
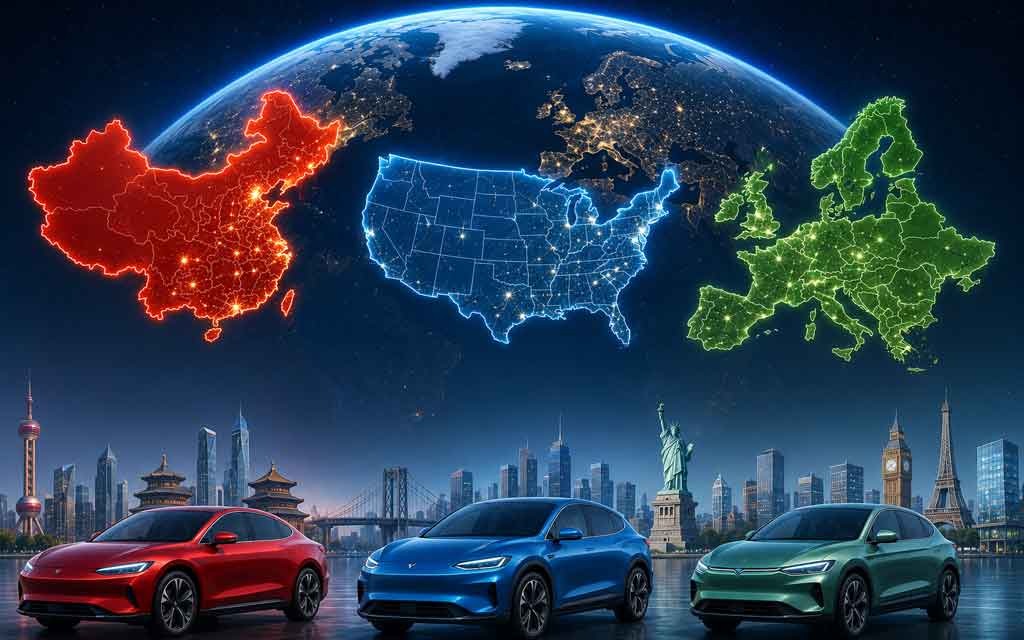
Compare EV market share across China, the US, and Europe in 2026. Get the latest data, exact figures, growth trends, and which region leads global electric vehicle adoption.
China continues to dominate the global EV transition, while Europe maintains steady progress and the United States lags significantly in battery electric vehicle adoption. Here’s a clear, data-driven comparison of EV market share in China, the United States, and Europe in 2026, based on the latest available figures.
EV Market Share Overview – 2026
Global EV Market Comparison (2026)
- China
- EV/NEV Market Share: 50–60%
- BEV Share: 35–42%
- Total Electrified Share (BEV + PHEV + HEV): Very High
- 2026 Trend: Strong but moderating growth
- Key Factor: Large-scale production and continued government policy support
- Europe
- EV/NEV Market Share: 20–25%
- BEV Share: 20–30%
- Total Electrified Share (BEV + PHEV + HEV): 40–45%+
- 2026 Trend: Steady growth
- Key Factor: Strict emissions regulations and purchase incentives
- United States
- EV/NEV Market Share: 6–10%
- BEV Share: 5.7–7%
- Total Electrified Share (BEV + PHEV + HEV): 10–15%
- 2026 Trend: Flat to declining
- Key Factor: End of federal EV tax credits and changing policy environment
China EV Market Share – 2026
China remains the undisputed global leader in electric vehicle adoption.
- Full-year 2026 projection: Electric vehicles (including BEVs and PHEVs/EREVs) are expected to reach nearly 60% of total new car sales.
- Monthly penetration in early and mid-2026 frequently exceeded 50%, with some months approaching or surpassing 60%.
- In June 2026, major Chinese manufacturers reported strong volumes:
- BYD: 403,472 units
- Leapmotor, Zeekr, Nio, Xpeng, and Li Auto also posted robust numbers.
Why China leads:
- Massive domestic manufacturing scale
- Highly competitive pricing
- Strong government support and infrastructure development
- Rapid consumer adoption of both pure EVs and plug-in hybrids
China’s NEV (New Energy Vehicle) category continues to grow, even as overall growth rates moderate from previous peak years.
United States EV Market Share – 2026
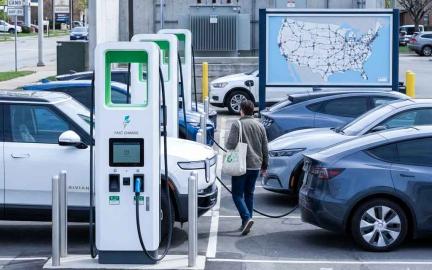
The US market has faced significant headwinds following the phase-out of the federal EV tax credit in late 2025.
- Current EV market share: Approximately 5.7–7% for battery electric vehicles.
- Total electrified share (including hybrids): Around 10–15%.
- New EV sales in May 2026 were estimated at roughly 84,000–87,000 units, representing a decline of about 22% year-over-year.
- Hybrid vehicles (especially non-plug-in) have seen strong growth as buyers seek more affordable electrified options.
Key Trend: Pure EV demand weakened after incentives ended, while hybrid sales accelerated through the first half of 2026.
Europe EV Market Share – 2026
Europe holds a solid second position globally, though adoption varies significantly between countries.
- BEV market share: 20–25% across Europe (higher in leading markets).
- UK (June 2026): BEV share reached a record ~30%, with PHEVs adding another ~12%.
- Total electrified share (BEV + PHEV + full hybrids): Frequently exceeds 40–45% in many markets.
- Strong performance continues in countries with active incentives and strict emissions regulations.
Europe’s strength comes from consistent regulatory pressure and targeted support in several key markets, helping maintain steady growth even as some incentives evolve.
Head-to-Head Comparison: China vs US vs Europe (2026)
| Metric | China | Europe | United States | Leader |
|---|---|---|---|---|
| BEV Market Share | 35–42% | 20–30% | 5.7–7% | China |
| Total Electrified Share | Highest | 40–45%+ | 10–15% | China |
| Monthly Sales Volume | Extremely high | Strong | Significantly lower | China |
| Growth Momentum | Strong (slowing) | Steady | Weak | Europe |
| Hybrid Strength | Very strong | Strong | Very strong (rising) | US/China |
| Policy Environment | Very supportive | Supportive (varies) | Weakened | China |
Key Insights from 2026 Data
1. China is operating on another level With an expected EV/NEV market share of nearly 60%, China accounts for the majority of global electric vehicle sales and continues to set the pace for the entire industry.
2. Europe maintains a clear second position Strong regulations and selective incentives have helped Europe achieve significantly higher EV adoption than the US, though it still trails China by a wide margin.
3. The United States is falling further behind in pure EV adoption The removal of federal tax credits led to softer demand for battery electric vehicles. However, hybrid vehicles are gaining strong traction as a more affordable transition option.
4. Different regions are choosing different paths
- China: Heavy focus on both BEVs and PHEVs/EREVs
- Europe: Balanced growth across BEVs and hybrids
- US: Shift toward hybrids while pure EV growth slows
5. The global gap is widening The divergence between China/Europe and the United States in EV adoption rates has become more pronounced in 2026.
What to Expect in the Second Half of 2026
- China is expected to maintain its dominant position, though growth may continue moderating from previous highs.
- Europe should see steady progress, supported by regulatory frameworks.
- United States may experience some stabilization or modest recovery in EV sales if new incentives, leasing programs, or competitive pricing emerge. Hybrids are likely to remain the stronger growth category in the near term.
Final Thoughts
The global EV transition in 2026 is no longer a uniform story. China leads by a massive margin, Europe follows with consistent policy-driven growth, and the United States has seen its momentum slow significantly after major policy changes.
These regional differences will continue to shape the global automotive industry, supply chains, and technology development for years to come.


Leave a Comment