
In-depth 2025-2026 comparison of EV (BEV), hybrid (HEV/PHEV), and traditional ICE vehicle sales and market shares in the USA, UK, and China. Data-driven analysis with tables, policy impacts, infrastructure, consumer trends, and future outlook. Sources: IEA, SMMT, CAAM, Argonne National Lab.
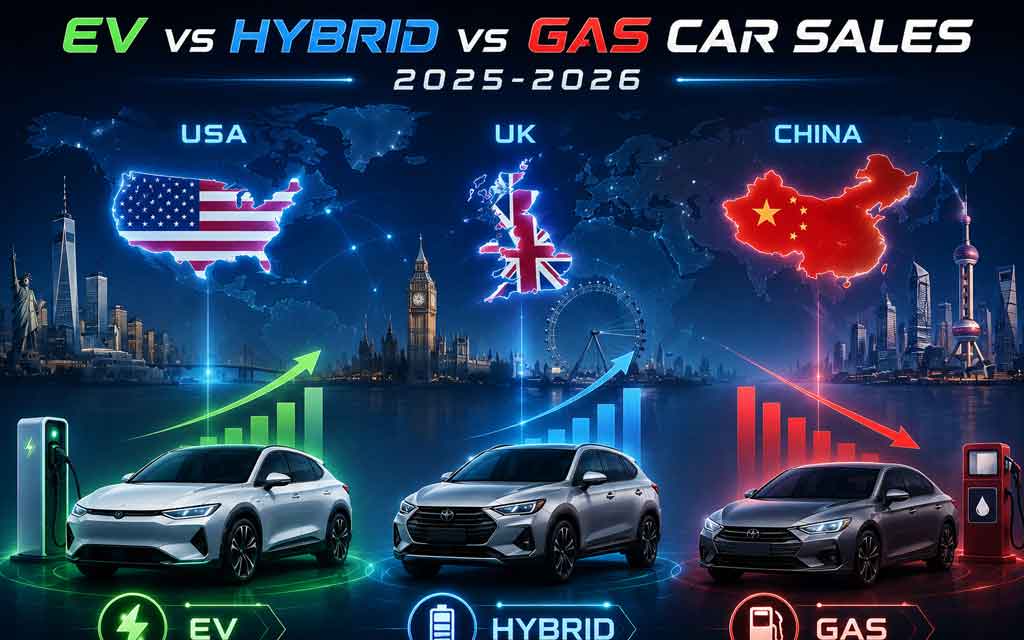
EV, Hybrid, and Traditional Vehicle Sales: A Detailed Comparison of USA, UK, and China (2025-2026)
The global shift to electric mobility is no longer a straight line — it’s a tale of three very different markets. China is racing ahead with massive scale and policy support, the UK is methodically advancing through regulation and fleet incentives, while the United States shows a more complex picture: pure EV sales faced headwinds after incentives ended, but hybrids surged as a practical bridge.
Here’s a comprehensive, data-backed comparison of EV, hybrid, and traditional auto (ICE) sales across these three major markets using the latest available figures from 2025 (full year) and early 2026 trends.
1. Total Vehicle Market Sizes (2025)
Vehicle Sales Overview by Country (2025)
- USA: ~16.3 million new light vehicles sold
- Market Type: Cars, SUVs, and pickup trucks
- Year-over-Year Growth: +2.3% to +2.4%
- Key Trend: SUVs and light trucks account for approximately 75–80% of total sales
- UK: ~2.02 million passenger cars sold
- Market Type: Passenger cars
- Year-over-Year Growth: +3.5%
- Key Trend: Strong influence from fleet and company car purchases
- China: 34.4 million total vehicles sold (including 30.1 million passenger cars)
- Market Type: Passenger and commercial vehicles
- Year-over-Year Growth: +9.4%
- Key Trend: Largest automotive market in the world, with passenger cars representing around 30 million sales annually
China’s market is more than double the size of the US and over 15x the UK. Volume alone gives it unmatched influence on global supply chains, battery production, and pricing.
2. EV (Battery Electric Vehicle) & Plug-in Sales Performance
China remains the undisputed leader.
- NEV share (BEV + PHEV): Nearly 55% of new car sales in 2025 (IEA Global EV Outlook 2026). Some months in 2026 exceeded 56-60%.
- Estimated NEV volume: ~15–17 million units (wholesale/retail mix; strong export component).
- BEVs form the majority, but PHEVs (including range-extender models) make up a significant and growing portion (~30-40% of NEVs).
United Kingdom delivered steady, regulation-driven progress:
- BEV share: 23.4% (473,348 units)
- PHEV share: 11.1%
- Total plug-in share: 34.5%
- Strong growth continued into 2026 (BEV ~23.9% YTD in early data).
United States saw volatility:
- Plug-in EV (BEV + PHEV) share: 9.1% (~1.5 million units), slightly down from 9.9% in 2024.
- BEVs made up the bulk (~80%+ of plug-ins).
- Pure BEV share hovered around 7–8% for the full year, with a sharp drop in Q4 2025 and into Q1 2026 after federal tax credits ended.
Key takeaway: China’s EV/NEV penetration is 5–6x higher than the US. The UK sits in a strong middle position for a Western market.
3. Hybrid Vehicles: The Surprising Bridge in the West
Hybrids (non-plug-in HEV and PHEV) tell a different story:
- USA: Hybrids (especially HEV) gained significant traction in 2025 as pure EV momentum slowed. Monthly HEV sales often exceeded 200,000 units (Toyota dominant). Many analysts estimate total electrified (HEV + PHEV + BEV) share approached or exceeded 18–22% in strong periods. Hybrids appealed due to no charging requirement, proven reliability, and improving efficiency in SUVs/trucks.
- UK: HEV share around 14%, with PHEVs adding another 11%+. Total electrified vehicles approached 48–50% of the market.
- China: PHEVs are a major part of the NEV category (not counted as traditional “hybrids”). Non-plug-in HEVs play a smaller role as the market pushes toward higher electrification. PHEV sales remained robust even as some domestic demand fluctuated.
Hybrids are acting as a practical “bridge” technology in the US and UK, especially where charging infrastructure, upfront costs, or long-distance travel concerns persist.
4. Head-to-Head Comparison Table (2025 Approximate Shares)
Powertrain Market Share Comparison (2025)
- BEV (Battery Electric Vehicles)
- USA: ~7–8%
- UK: 23.4%
- China: ~35–40%+ of NEV sales
- Insight: China leads both in EV volume and market share
- PHEV (Plug-in Hybrid Electric Vehicles)
- USA: ~1.5–2%
- UK: 11.1%
- China: ~15–20%
- Insight: UK and China show strong PHEV adoption
- HEV (Non-Plug-in Hybrid Vehicles)
- USA: ~10–12% (estimated)
- UK: ~14%
- China: Lower adoption, with consumers favoring PHEVs
- Insight: USA and UK lead traditional hybrid adoption
- Total Electrified Vehicles (BEV + PHEV + HEV)
- USA: ~18–22%+
- UK: ~48–50%
- China: ~55%
- Insight: China has the highest electrified vehicle penetration
- Traditional ICE Vehicles
- USA: ~75–80%
- UK: ~50–52%
- China: ~45%
- Insight: China has the lowest dependence on internal combustion engine vehicles among the three markets
Sources: Aggregated from IEA Global EV Outlook 2026, SMMT (UK), Argonne National Laboratory (US), CAAM, Cox Automotive, and industry reports.
5. Why the Huge Differences? Key Driving Factors
Policy & Incentives
- China: Long-term NEV mandates, trade-in subsidies (with temporary pauses), local government support, and massive state-backed charging rollout.
- UK: Strict CO₂ standards, company car tax advantages (BIK), and ZEV mandate trajectory pushing fleets and manufacturers.
- USA: Inflation Reduction Act (IRA) tax credits boosted sales until they ended in late 2025 → major Q4 pull-forward then sharp drop. Policy uncertainty and potential tariffs on Chinese imports added complexity.
Infrastructure & Consumer Behavior
- China built the world’s largest charging network and benefits from dense urban living + competitive low pricing (BYD, etc.).
- US: Excellent for highway road trips in theory, but inconsistent public charging and strong cultural preference for large SUVs/trucks favor hybrids.
- UK: Good urban charging progress but challenges with on-street parking in older housing stock. High fuel prices help electrified options.
Manufacturing & Pricing China’s intense domestic competition has driven EV/PHEV prices down dramatically, making them accessible. The US and UK still face higher average transaction prices for many EVs, though hybrids close the gap.
6. Early 2026 Trends & Outlook
- USA: EV sales stabilized at lower levels (~6% share in early 2026 data) while hybrids remained resilient. Long-term trajectory depends heavily on policy and new model launches (including affordable options).
- UK: On track for continued share gains (SMMT forecasts BEV ~26.8% for full 2026). PHEV growth particularly strong.
- China: NEV share holding firm above 50–55% with record exports helping offset occasional domestic softness. Chinese brands continue global expansion.
Longer-term (to 2030): China is expected to maintain 60%+ EV/NEV share. Europe/UK will push higher through regulation. The US path remains the most uncertain but hybrids will likely remain a major part of the mix for years.
FAQs
Which country has the highest EV adoption? China by a wide margin (~55% NEV share vs ~23% BEV in UK and ~7–10% plug-in in US).
Why are hybrids so popular in the US right now? They offer better fuel economy than pure ICE without the charging commitment or higher price of many EVs, especially in the popular SUV and truck segments.
Is China’s EV dominance sustainable? Yes in volume and manufacturing, though domestic price wars are intense. Exports are becoming a major growth driver despite tariffs in some markets.
Will hybrids eventually disappear? In China, PHEVs are already a stepping stone. In the US and UK, non-plug-in hybrids may remain relevant longer as affordable electrification options.
Bottom Line for Tech & Future Mobility
The data shows no single global path to electrification. China is executing the most aggressive full-EV transition at unprecedented scale. The UK demonstrates what strong, consistent policy can achieve in a mature Western market. The United States is taking a more pragmatic, hybrid-inclusive route amid policy shifts.
For investors, automakers, and tech companies, this divergence creates opportunities:
- Battery tech, software-defined vehicles, and autonomy will advance fastest where adoption is highest (China + leading European markets).
- Hybrid powertrain innovation and affordable EV platforms remain critical for the US market.
- Supply chain resilience and export strategies will define winners in the coming decade.
The electric future is arriving — just at different speeds and in different forms depending on where you are.
Data current as of mid-2026 reporting on 2025 full-year and early 2026 results. Figures are approximate based on IEA, SMMT, CAAM, ANL, Cox Automotive, and industry analyses. Always verify latest official releases for investment decisions.
Want more on EV tech, battery breakthroughs, autonomous driving, or specific model comparisons? Explore our latest coverage on vfuturemedia.com or let us know what deep dive you’d like next.


Leave a Comment