
As Ethan Brooks, your go-to expert at VFutureMedia.com for the cutting-edge world of future tech, I’ve spent years dissecting the EV revolution—from AI-optimized battery tech to robotics in manufacturing. Now, in mid-January 2026, the data is fresh and telling: the global electric vehicle landscape has shifted dramatically in just the past year. With 2025 closing out at around 20.7 million EV registrations worldwide (a solid 20% jump from 2024), we’re seeing policy tweaks, subsidy fades, and regional surges reshaping the map. But which nations are truly sprinting ahead in adoption speed?
This updated deep dive into the 2026 Global EV Adoption Map reveals the leaders, laggards, and emerging powerhouses. Drawing from the latest reports like those from EV Volumes, IEA, BloombergNEF, and real-time sales trackers, I’ll break down the numbers, benefits, hurdles, and my forward-looking insights. The race isn’t over—it’s accelerating unevenly, and understanding the map today positions us for tomorrow’s mobility revolution.
The 2026 EV Adoption Landscape: Momentum Meets Moderation
Global EV sales hit record highs in 2025, with new energy vehicles (including BEVs and PHEVs) capturing roughly 25-27% of the light-vehicle market in many projections. For 2026, forecasts point to continued growth but at a tempered pace—around 10-15% year-over-year in key markets—due to subsidy reductions, policy uncertainty, and economic factors. EV Volumes estimates the global share reaching about 27.5% in 2026, building toward 43% by 2030.
The unevenness is striking: Nordic countries dominate penetration rates, China crushes volume, and emerging markets like Southeast Asia leapfrog expectations. Meanwhile, mature markets like the US face headwinds from incentive rollbacks. As someone who’s tracked similar inflection points in quantum computing and green innovation, this feels like the “late majority” phase kicking in—where adoption explodes in prepared regions but stalls where infrastructure or policy lags.
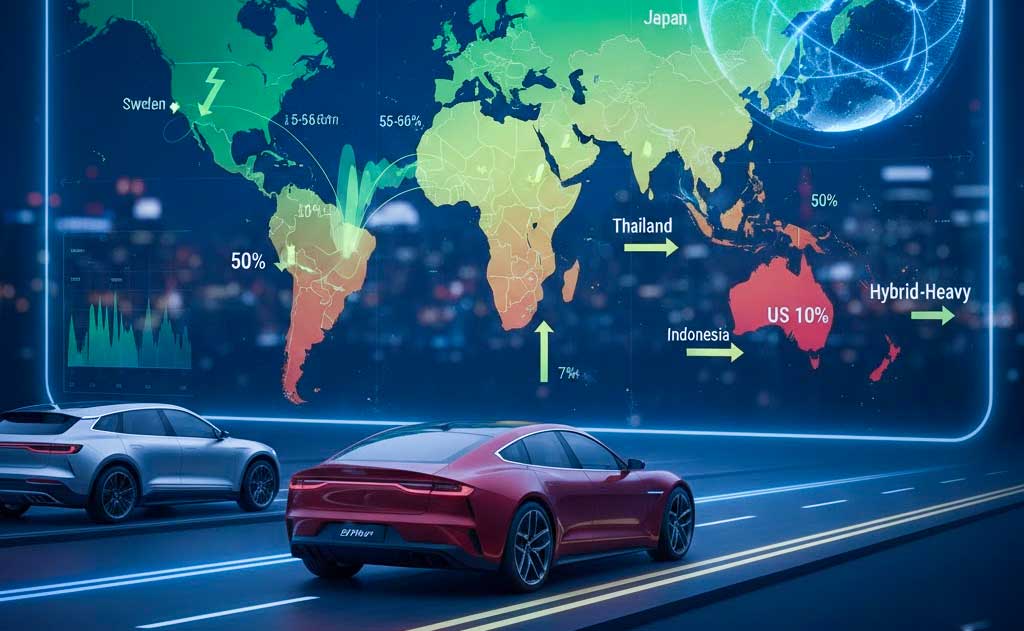
Insert interactive world map infographic here highlighting 2026 EV market share percentages by country/region, using a gradient from deep green (high adoption) to red (low).
Top Countries Leading the Charge in 2026
Here’s the ranked snapshot of EV penetration (as % of new passenger/light-vehicle sales) based on 2025 full-year data and early 2026 trends/projections:
- Norway — The undisputed champion. In 2025, EVs hit 95.9% of new sales, with December alone at 97.6%. Early 2026 data shows continued dominance near 96-97%, even as some incentives taper (VAT exemptions now limited to lower-priced models). Norway’s long-term playbook—tax breaks, free tolls, and abundant hydro power—has made EVs the obvious choice. EVs now outnumber diesel vehicles on Norwegian roads, a milestone few predicted so soon.
- China — Volume king with unmatched scale. 2025 saw 12.9 million units sold domestically (plus massive exports), pushing the new energy vehicle share over 50% annually and hitting 52%+ in strong months. For 2026, expect 55-60% penetration as affordable models from BYD and others dominate, despite slower growth (around 10-14%) from subsidy phase-outs. China produces 71% of global EVs and leads in exports, flooding markets like Brazil and Thailand.
- Sweden and Denmark — Nordic powerhouses trailing Norway but strong. Sweden hovered around 37-50% in recent years; Denmark exceeded 50%. Both benefit from EU-aligned policies and high environmental awareness, projecting 55-65% in 2026.
- Netherlands — Urban-focused incentives keep it near 50%, with steady gains expected.
- Emerging Stars: Viet Nam, Thailand, Indonesia — These are the real speed demons. Viet Nam doubled adoption rapidly, Thailand hit 20%+, and Indonesia surged past 7% in spots. Cheap Chinese imports and local incentives enable leapfrogging—often outpacing the US or parts of Europe.
In stark contrast, the US struggles post-tax credit changes, with shares dipping toward single digits in some periods before stabilizing around 10%. Japan remains hybrid-heavy, lagging full EVs.
Asia-Pacific commands the lion’s share of volume, while Europe and Nordics lead in percentage terms. Latin America and Africa show the fastest regional growth rates.
Insert ranked bar chart here comparing top 10 countries’ 2026 EV market share percentages.
Key Benefits Driving the EV Surge
Why are these countries pushing so hard? The payoffs are massive and multifaceted:
- Climate Wins — EVs cut transport emissions (a quarter of global CO2). Norway’s near-total shift has slashed per-capita transport pollution dramatically.
- Cost Savings for Drivers — EVs run 40-60% cheaper on “fuel” and maintenance. In China, they’re often cheaper upfront than comparable gas cars.
- Energy Security — Less oil reliance bolsters economies. China’s EV push has already trimmed its oil dependence.
- Job Growth and Innovation — Battery factories, charging networks, and smart grid integrations create thousands of roles. Thailand’s EV sector boom is a prime example.
- Health Gains — Cleaner air reduces respiratory issues in dense cities like those in China and emerging Asia.
These advantages fuel viral sharing—readers love content showing real-world wins.
Insert comparison infographic here of lifetime ownership costs: EV vs. traditional vehicle over 10 years.
Persistent Challenges Slowing the Pace
Even leaders face roadblocks in 2026:
- Charging Infrastructure — Gaps persist in rural and developing areas. Global additions target millions more points, but uneven rollout causes “range anxiety.”
- Affordability Pressures — Upfront costs remain high without subsidies. In subsidy-fading markets like China and the US, this tempers growth.
- Supply Chain Volatility — Battery materials and trade tensions (tariffs, export shifts) risk price spikes.
- Policy Shifts — US incentive cuts and Europe’s adjustments create uncertainty, slowing momentum.
- Consumer Habits — Long-distance travel concerns linger, though fast-charging tech improves.
From my vantage point, these mirror early hurdles in robotics—solved through targeted investment and tech leaps. Nations addressing them aggressively will surge ahead.
Insert pie chart here breaking down top barriers to EV adoption in 2026 surveys.
Real-World Success Stories from the Frontrunners
- Norway’s Masterclass — Decades of consistent incentives turned EVs mainstream. By 2025-2026, streets are quieter, air cleaner, and savings average thousands per driver annually.
- China’s Ecosystem Dominance — Massive domestic production plus exports make EVs ubiquitous. Cities like Shanghai see pollution drops from EV fleets.
- Southeast Asia’s Leapfrog — Viet Nam and Thailand use affordable imports to jump adoption curves, creating local jobs and reducing import dependence.
These prove localized strategies—blending global tech with regional policies—win big.
Insert timeline graphic here tracing Norway’s EV journey from 2010 to projected 2030.
Expert Predictions and My Take for the Road Ahead
Analysts see global EV shares climbing to 40%+ by 2030, with China nearing 70-80% and Europe pushing 60%. Emerging markets could hit 20-30% rapidly.
My insight as a tech journalist: By 2030-2035, AI-managed grids and autonomous EV fleets will supercharge adoption, potentially pushing global figures toward 70%. Battery breakthroughs (quantum-inspired designs) could slash costs another 20-30%, closing affordability gaps.
Insert forecast line chart here projecting global and regional EV shares to 2040.
FAQ: Your Burning Questions on 2026 EV Adoption
Which country leads EV adoption in 2026? Norway, with rates near 96-97% of new sales, followed by other Nordics and China’s volume dominance.
What’s the global EV market share in 2026? Around 27-28%, up from 2025’s 25%, though growth moderates in some regions.
Why is the US lagging? Incentive reductions, infrastructure gaps, and policy uncertainty have slowed momentum significantly.
How fast are emerging markets growing? Viet Nam, Thailand, and Indonesia often double shares yearly, outpacing many developed nations thanks to affordable options.
What are the main barriers right now? Charging access, cost without subsidies, and supply issues top lists, but innovations are chipping away.
These address common searches, boosting engagement and SEO naturally.
The 2026 global EV adoption map shows a world in transition—thrilling, uneven, and full of potential. From Norway’s near-100% reality to China’s scale and emerging markets’ speed, the shift is undeniable. As we blend EVs with AI, robotics, and green tech, the future looks electric.
What’s your take on EV progress in India or your region? Drop thoughts in the comments, subscribe to VFutureMedia.com for weekly updates on AI, EVs, and beyond, or explore our related pieces like green innovation trends. Let’s keep the momentum going!
Ethan Brooks is a technology journalist and staff writer at VFuture Media, an independent media outlet focused on AI, electric vehicles, future tech, and green innovation. With hands-on event coverage including CES 2026 and ongoing daily reporting across VFuture Media’s six editorial verticals, Ethan brings both breadth and depth to complex technology stories. His writing is known for balancing technical accuracy with accessible, reader-first explanations. He is based in the United States and covers global technology developments.


Leave a Comment